
In Part 1, we covered the theory of Head & Shoulder (H&S) patterns and how they look across different time frames. In this Part 2, we move to past market examples where the H&S pattern has already played out.
The idea is simple: learning from history. By reviewing past H&S cases, you will:
* Build confidence in spotting valid vs invalid setups.
* Understand how price behaves around the neckline and shoulders.
* Train yourself to wait for confirmation and avoid premature entries.
—
Example Studies
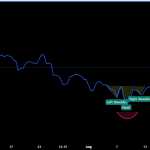
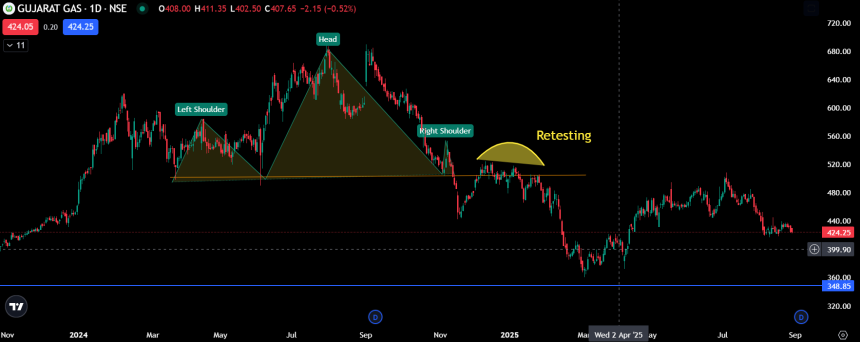
1. Gujarat Gas

* Retesting is usually the best entry in H&S.
* But do we practice it religiously?
* Earlier, my confidence was low until I learnt proper level marking (thanks to i4option mentor).
* Now, I wait patiently for my levels like an eagle.
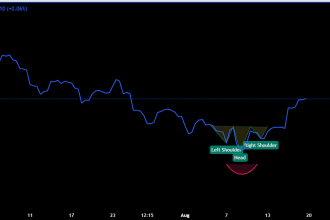
2. Hero MotoCo

* Found sideways channel formation after right shoulder.
* Question: was my H&S valid?
* Key observations:
* If right shoulder high point is broken → H&S invalid.
* If not broken → original direction estimate holds.
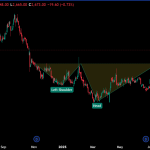
3. Hindustan Unilever

* When confused, switch to Line Chart.

* If left shoulder took long to form, expect similar time for right shoulder.
* Gap-up opening = strong indication of successful breakout.
4. Angel One

* I would like to name this entity as Godfather of H&S.
* Example of how macro news affects pattern: stock fell after SEBI chairman hinted at changes in expiry rules.
* Reminder: Fundamentals can sometimes override technicals.
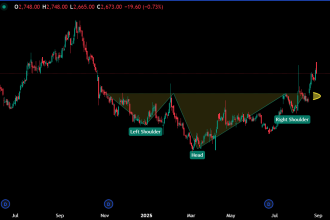
5. Navin Fluorine

* H&S formed at the top of a bull run – already a red flag.
* Once right shoulder broke, trend direction was clear.
* But I avoid such opposite trades unless Risk:Reward ≥ 1:3.
6. Alkem Laboratories

* Did not follow the H\&S trajectory.
* Stock bounced back from neckline → showing bullish behaviour instead.
* Lesson: H\&S doesn’t always play out.
7. Dr. Lal Path Labs

* Expected right shoulder in a circular region → but price broke straight below neckline.
* Confusion resolved via Line Chart:

* H&S had already formed.
* After sideways action, neckline broke and bull run started.
—
## Key Takeaways
* Past examples are your best teacher. Review them to sharpen instinct.
* Always check line charts when candlesticks confuse you.
* Right shoulder behaviour decides validity.
* Neckline reactions (bounce or break) reveal true market bias.
* Combine H\&S with risk:reward logic – never trade for less than 1:3.
—
📌 Homework for Readers: Revisit charts of these stocks on your system. Draw the neckline, mark the shoulders, and check whether you would have traded or avoided. Compare your judgment with the actual outcome – this is how you build conviction.