


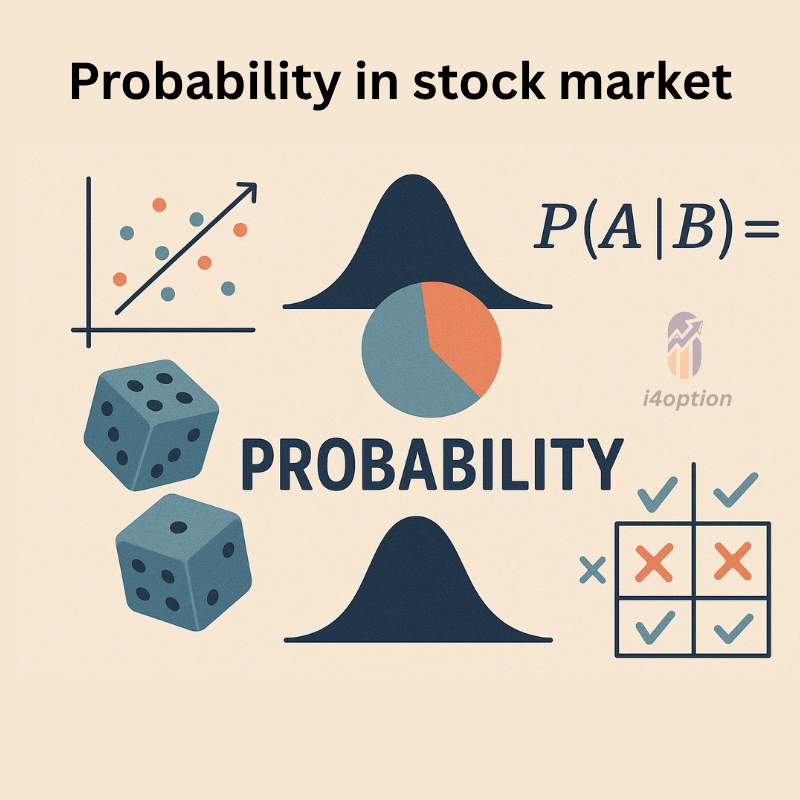
What is Probability?
Probability is essentially the language of chance. It answers the question, “How likely is a certain event to happen?” Formally, probability measures the likelihood that an event will occur, expressed as a number between 0 and 1 (or 0% to 100%). An event with probability 0 is impossible, while an event with probability 1 is certain to happen. Most events fall somewhere in between – the higher the probability, the more confident we are that the event will occur.
In everyday life, we constantly use probability (even if we don’t call it that). For example, a weather report might say there’s a 30% chance of rain tomorrow. This means meteorologists believe rain is somewhat unlikely but still possible. In sports, you might hear that a team has a 75% chance to win a game based on analysts’ models, suggesting they are favored to win. Probability provides a consistent way to quantify uncertainty in all these cases.
Basic Examples of Probability:
- Coin Toss: Flipping a fair coin has a 0.5 probability (50% chance) of landing heads and 0.5 for tails. Each outcome is equally likely.
- Rolling a Die: Rolling a fair six-sided die has a 1/6 (~16.7%) chance of landing on any given number (say, a 4). There are six equally likely outcomes, so each has a probability of 0.167.
- Random Day in the Market: Historically, the stock market (e.g., the Nifty 50index) is up on about 53–55% of trading days and down on the rest. So, if you pick a random day, there’s roughly a 0.55 probability the market closes higher than it opened. This is an empirical probability based on past data.
In mathematical terms, the probability of an event = (number of favorable outcomes) / (total number of possible outcomes), if all outcomes are equally likely. For instance, the probability of drawing an Ace from a standard deck of cards is 4/52 (there are 4 favorable outcomes – the four Aces – out of 52 possible cards) = 0.077 or 7.7%. In cases where outcomes are not equally likely (like predicting rain, which depends on complex weather factors), probabilities are estimated using historical frequencies or models rather than simple fractions.
Why Probability Matters in Trading: Traders often think in probabilities rather than certainties. For example, instead of saying “This stock will go up tomorrow,” a seasoned trader might say “I feel there’s about a 70% chance this stock goes up tomorrow.” Everything in markets is uncertain – even the best analysis can be upended by unexpected news. By assigning probabilities, traders can quantify their confidence and manage risk.
- A trader might estimate the probability of hitting a particular price target or the probability that a stock’s price will fall below a stop-loss level.
- Portfolio managers use probability models to assess the likelihood of various returns. For instance, they may ask: “What’s the probability my portfolio will lose more than 5% in a month?” This is related to measures like Value at Risk, which relies on probability distributions of returns.
Key Takeaways: Probability provides a framework for decision-making under uncertainty – a daily reality in the stock market. By understanding probability, traders and investors can make more rational decisions, weigh risks versus rewards, and avoid the trap of assuming outcomes are guaranteed. In summary, probability is the backbone of risk management: it lets us replace gut feelings with quantifiable odds, whether we’re dealing with coin flips or stock picks.
Single Event vs. Sequence of Events: Understanding Probabilities in Trading
Not all probabilities are created equal – there’s a big difference between the probability of a single event and the probability of a sequence of events. In practical terms, “What are the chances of X happening once?” versus “What are the chances of X happening n times in a row?” can yield very different answers. Let’s break this down with simple examples and then connect it to trading scenarios.
Single Event Probability
A single event probability is straightforward. It’s the chance of one outcome or event occurring on a given try. For example:
- The probability of a fair coin landing heads on one toss is 0.5 (50%).
- The probability it rains in London on a random day might be, say, 30% (based on weather records).
- The probability that a particular stock closes up on a given day can be estimated from historical data (for instance, ~55% for the Nifty 50 on any random day, since historically slightly more than half of days are positive).
This single-event probability doesn’t concern itself with any other outcomes before or after – it’s just the chance of that one instance.
In trading, you might ask: “What’s the probability that my trade will be profitable?” If you have a strategy that wins 60% of the time, then for any one trade,
. That’s a single-event probability for a trade’s success.
Sequence (Compound) Event Probability
When you look at a sequence of events happening in combination, the probability usually multiplies and hence becomes smaller (assuming the events are independent). This is often called compound probability or the probability of joint events.
For independent events :
(where one outcome doesn’t affect the other, like separate coin tosses or back-to-back days assumed independent), The probability of all events occurring is the product of their individual probabilities.
- Two Coin Tosses: Probability of getting heads twice in a row = 0.5 (first toss) × 0.5 (second toss) = 0.25 or 25%. Even though each toss had a 50% chance for heads, two in a row drops to 25%.
- Five Coin Tosses (all heads):
- Two Independent Trading Wins: If each trade has a 60% success rate (and outcomes don’t influence each other), then the chance of winning two trades in a row is 0.6 × 0.6 = 0.36 (36%). The more consecutive wins you string together, the smaller the probability gets (e.g., three in a row would be
In trading terms, consider daily stock movements. If a stock has roughly a 55% chance of being up on any given day (as per historical average), the chance it’s up five days in a row is This tells you streaks of five up-days, while not impossible, are relatively rare just by pure chance. (In reality, day-to-day movements might have some correlation, but this gives a ballpark idea.)
It’s important to differentiate “single vs sequence” because humans often underestimate how quickly probability shrinks when you require multiple successes in sequence. For example, if you need five independent things to all go right for a plan to succeed, even if each is 80% likely, the joint probability is
Dependent Events:
If events are not independent, things get a bit more complex. For instance, the probability of drawing two aces in a row from a deck without replacement is not simply
, because after one ace is drawn, the deck composition changes. In trading, events can be dependent too (if the market goes up today, it might slightly influence the probability of tomorrow going up due to momentum or investor sentiment). In such cases, we use conditional probability formulas. But to keep it simple, the key idea is that each additional condition generally makes the combined event less likely.
Real-World Trading Examples:
- Consecutive Daily Moves: What’s the probability that a stock goes up three days in a row? If each day is ~50/50 for simplicity, then about 12.5%. Traders track streaks like these to see if trends are occurring more often than chance (which might indicate momentum).
- Multiple Criteria: What’s the probability that Stock A rises this week AND Stock B rises this week? If each has say a 70% chance to rise in a given week (independently), then the probability both rise in the same week is 0.7 × 0.7 = 0.49 (49%). This is an “AND” probability for two events. If you needed three stocks all to be up in the week (an “AND” of three events), and each is 70%, the joint probability is (34.3%)
- Trading Strategy with Sequential Goals: Suppose a trader has a rule: they will only enter a trade if two indicators give a positive signal in a row (say, two days of a certain pattern). If each day’s pattern has, for example, a 30% chance of giving a “go” signal, then getting two such signals back-to-back has, i.e 9% probability (assuming independence for simplicity). So the sequence criteria is much stricter than a single-day criterion.
“Or” vs “And”: It’s worth noting that the probability of either of two events happening (an “A or B” scenario) is higher than the probability of each one alone – you add probabilities (minus any overlap). For instance, the probability it rains today or tomorrow is higher than the probability it rains today. But the probability it rains today and tomorrow is lower than either single-day probability. In trading, the probability that at least one of your next two trades is profitable is greater than the probability that the very next trade is profitable (you have two shots at success). However, the probability that both of your next two trades are profitable is lower than for one trade alone.
Key Takeaway:
A single event probability is usually larger than the probability of a sequence of multiple events occurring. For independent events, probabilities multiply for sequences (“AND” scenarios), which causes the odds to shrink quickly as you add requirements. Traders must be mindful of this when setting goals (like “I want 10 wins in a row”) or when multiple conditions must align for a trade. Each additional condition or required success dramatically lowers the overall probability of success. By understanding this, one can set more realistic expectations and better manage the risks of complex trades or strategies.
In the next post, we will discuss probability functions used to calculate the probability of outcomes & the probability for options trading.
If you are getting knowledge and information, don’t forget to share posts and queries are welcome in the comments.


Thank you for this insightful post! I really appreciate the clear explanations and practical tips — it made the topic much easier to understand. Looking forward to more content like this!
Thank You Manoj Sir.
Great insight to applying maths to stock market. Changed the way to look at the market dynamics.
Regular follower, since I discovered Manoj ji on YouTube from 2023 onwards.
Hope to learn more from you.